Home

PeliKalc Broker Commission Calculation & Reporting System and Unit Based Sales Forecasting

PeliKalc™ provides food manufacturers the tools needed for easy calculation and reporting of accurate broker commissions to insure timely payments to their brokers.   Detailed commission statements provide each broker the line item detail necessary to confirm the accuracy of their payments, including invoice detail, allowable deductions, credit memos and marketing payments.  PeliKalc™ also provides a robust platform for unit based sales forecasting that is easy to configure and use for sales executives and the manufacturing planning team, and detailed consolidated Gross Margin Analysis by customer and item.

We also ingest your external distributor sales and deduction data from such companies as DOT, KeHE, McLane, Sysco and UNFI to name a few.  This gives you greater control and visibility to distributor activity and broker payments.

PeliKalc™ was written by Greg Helland,  a food company CEO/COO, that also owns/operates a software company.  He originally wrote this broker commission and reporting system to solve the age old problem of accurately calculating and reporting broker commissions.

Advantages of PeliKalc™ incudes:

  • $$ Savings from processing detailed deductions such as:
    • Damage
    • Billbacks
    • Off invoice
    • Cash payment deductions
    • Marketing programs including deductions for coupons, etc.
  • No Reentry of Data: Uses existing data from your accounting system
  • Commission Savings: Average hard dollar savings of 5% on commissions due to accuracy of detailed tracking of broker commissions due (See Manual vs PeliKalc Calculation PDF)
  • External Distributor data from DOT, KeHE, McLane, Sysco, UNFI and others can be integrated to your reporting and analysis.
  • Clerical Time Savings: Reduction in clerical time calculating and producing broker statements
    • Eliminates a myriad of spreadsheets that are maintained to calculate brokerage
    • Eliminates errors due to re-entry of or lack of visibility to data
  • Accuracy of Broker Payments increased
  • Gives higher visibility to this important expense category
  • Provides the financial tools needed to efficiently manage the broker network
  • Maintains all business rules and exceptions for each customer, item, broker and buying group
  • Maintains relationships between customers, brokers and master brokers
  • Handles exceptions to standard broker commissions
  • Flexibility: Processes broker commissions based upon invoice date or date paid
  • Handles broker commissions for re-distributer networks such as DOT
  • Reporting:
    • Audit reports for review before producing broker statements
    • Broker statements by broker
    • Broker statements by groups
    • PDF’s that can be attached to Accounts Payable entries for backup
    • Customer, broker and master broker relationship reports
    • Gross Margin Analysis reports that consolidates all allowable deductions + COGS + broker commissions to give the operator a true profit margin by customer.
  • Unit Based Sales Forecasting:
    • Output pre-formatted Excel worksheets for sales exec’s to forecast sales by customer by item number
    • Import unit based sales forecast worksheets back into PeliKalc™ so that production planning worksheets can be output for use by production and distribution planning teams.

Set up an online demo today for yourself or one of your team to see how PeliKalc™ can benefit your company.  Click Here to contact us.

More Information

Why Use PeliKalc™?

Food manufacturing and sales is a complex business. The many layers of distribution, redistribution, brokers, buying groups and sales people create a challenging environment when tracking the percentage that each layer demands.   The cost associated to brokerage in the food industry has traditionally been difficult and time consuming to calculate and audit.  Most food companies have very little visibility to this all important cost.

While sales teams are faithfully managing brokers and buying groups, the accounting team is trying to keep up with the minutia required to properly track and pay the brokers. This is further complicated when a re-distributor such as DOT Foods is inserted into the equation.  The re-distributor model adds more layers of payments, deductions, marketing programs and buying groups thereby complicating the brokerage cost accounting tasks.

Depending upon the size of the company tens of thousands to hundreds of thousands of dollars are lost annually to this seemingly benign function. Some companies calculate their brokerage costs on an item and invoice basis, daily dedicating people and spreadsheets to this function.  Other companies rely upon the brokers and buying groups to invoice them each month and do not regularly audit these charges.

Virtually every accounting system available today tracks one sales person to a customer and does not have the ability to add additional layers for brokerage commissions or buying group commissions. This is not a deficiency in these systems but rather a complex problem that accounting systems do not wish to address.

This has created an opportunity for a new application that aggregates data from other systems through a simple Excel spreadsheet import in order to calculate and monitor broker and buying group costs. The Brokerage Application affords the food company a system that can reduce their costs dramatically and increase accuracy and performance metrics.  Instead of maintaining brokerage percentages in a myriad of spreadsheets, the Brokerage Application maintains all of their business rules and exceptions for each customer, item, broker and buying group that will accurately maintain and calculate costs while giving high visibility to this important expense category.

Further, this visibility to the multiple layers and percentages that brokerage and buying groups cost the company gives management the tools to more intelligently negotiate brokerage contracts.

The first company that used this software went from two dedicated staff working in this arena down to one person spending about an hour a month to import and maintain brokerage calculations and produce a detailed brokerage and buying group statement for each entity involved. These statements were then used to enter accounts payable items into the accounting system.

Set up an online demo today for yourself or one of your team in order to see how PeliKalc™ can benefit your company.  Click Here to contact us.

Pictures

Pelikalc™ Application Views
click on images for full view

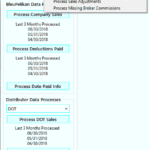
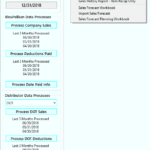
PeliKalc™ Main Window
PeliKalc™ Admin Menu
PeliKalc™ Reset Data Menu
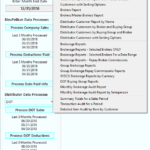
PeliKalc™ Reports Menu
PeliKalc™ Analysis & Forecasting Menu
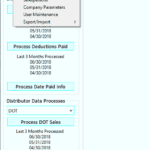
PeliKalc™ Distributor Selection

Set up an online demo today for yourself or one of your team to see how PeliKalc™ can benefit your company.  Click Here to contact us.
Unit Based Sales Forecasts & Production Planning

Unit Based Sales Forecasts & Production Planning

The PeliKalc™ Unit Based Sales Forecasting tools give you the flexibility and efficiency needed to effectively acquire sales projections from your sales team by customer by item using familiar Excel Spreadsheets for ease of use.

These tools are designed to work the way your sales people work so the learning curve for implementation is minimal.  Once you have configured how you want the system to output the forecast spreadsheets, PeliKalc™ takes over and does all the work.  You can also add in phantom forecast items by customer so that you can capture new product forecasts even before they are in your accounting/invoicing system.  These sales forecast items can then be consolidated into a new item number once it is in your accounting/invoicing system thereby maintaining all of the projection work done without having to re-enter data.

Highlights of the Unit Based Sales Forecasting System

  • Produce sales forecast workbooks to tabs by sales person, channel, territory, region or banner, whatever works best for your sales team.
    • Forecasts can be populated with prior years actual units sold as a basis, or, prior years actual multiplied by a percentage increase, or, with existing years forecast to date, or, completely blank row for sales team to fill in.
    • Forecasts can show 1 or 2 years of prior history by month in order to give sales team context to their projections.
    • You can specify versions for each iteration of forecast.
  • Email Excel workbooks to each salesperson for their customers only.  Focuses sales team on their book of business only.
  • Sales forecasts can be produced for an entire year or for specific months only. You can reforecast as many times as needed.  Months selected for projection are highlighted in order to focus sales team on needed projections.
  • When Excel workbooks are returned from the sales people, simply import the results into PeliKalc™, no need for manual re-entry of data.
    • At time of import, you can limit the months imported so that only desired data is acquired.
  • Once all forecasts are imported, you can produce consolidated production and distribution planning workbooks for the operations teams to use for manufacturing production planning and distribution planning.
    • Can output planning workbooks to tabs by banner, channel, territory region or sales person, whatever work best for your operations.
    • Output is sorted within tabs by item number and then customer with item number totals by month.
  • Significantly reduces the time and errors that are prevalent with systems that require manual entry and re-entry of data.

Example Workbooks 

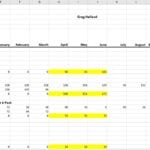
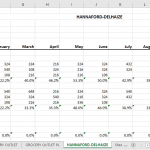
PeliKalc™ Sales Forecast by Salesperson. This is sent to each salesperson to fill out their unit based sales forecast for April, May and June.
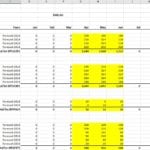
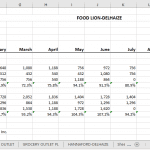
PeliKalc™ Forecast Planning Workbook - Results of Sales Forecast imported back into PeliKalc™ and resorted by forward warehouse and item number.

Set up an online demo today for yourself or one of your team in order to see how PeliKalc™ can benefit your company.  Click Here to contact us.
Unit Based Sales History

Unit Based Sales History

The PeliKalc™ Unit Based Sales History analysis reports provide you with valuable historical information that gives visibility to three year trends by Customer by Item. Sales history can be run with or without tabs so you can get the information in the format that best suits your needs.

Sales History can be configured to export to Excel your unit based sales history by seven (7) different tab based criteria as follows:

  • Banner (e.g. Alberstons/Safeway or Kroger – you configure these during implementation)
  • Broker
  • Channel
  • Region
  • Salesperson
  • Territory
  • No Tabs

Highlights of Unit Based Sales History

  • Produce sales history workbooks to tabs by broker, sales person, channel, territory, region or banner, whatever works best for your sales team.
    • Each time your run the sales history analysis you can choose how to configure tabs and years. Total flexibility.
    • Sales History can show 1 or 2 years of prior history by month as well as current year, in order to give sales team context to their analysis.
  • Email Excel workbooks to each salesperson for their customers only.  Focuses sales team on their book of business only.
  • By producing a sales history workbook by Broker, you are able to bring this analysis to your broker and discuss trends. You can focus their teams on your priorities.
  • Produce a sales history workbook of all consolidated sales and you will be able to see product trends.
  • Run the Sales History by Item Number workbook to get consolidated item number trends so you can determine velocity of sales by item.

Example Workbooks 

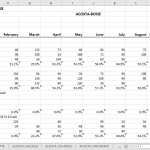
Sales History by Broker example - shows each customer by item number and stacked annual comparison.
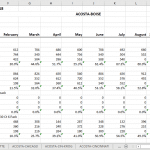
Sales History by Broker example - shows all sales history item recap for specified broker.
Sales History by Banner example - shows each customer by item number and stacked annual comparison.
Sales History by Banner example - shows all sales history item recap for specified banner.

Set up an online demo today for yourself or one of your team in order to see how PeliKalc™ can benefit your company.  Click Here to contact us.